
Introduction
This menu item will allow you access HUB Reports.
How to use
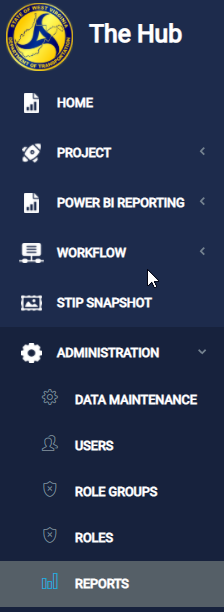
This is a menu item on the left hand menu of the HUB application. On selecting that link, you are navigated to the Reports page
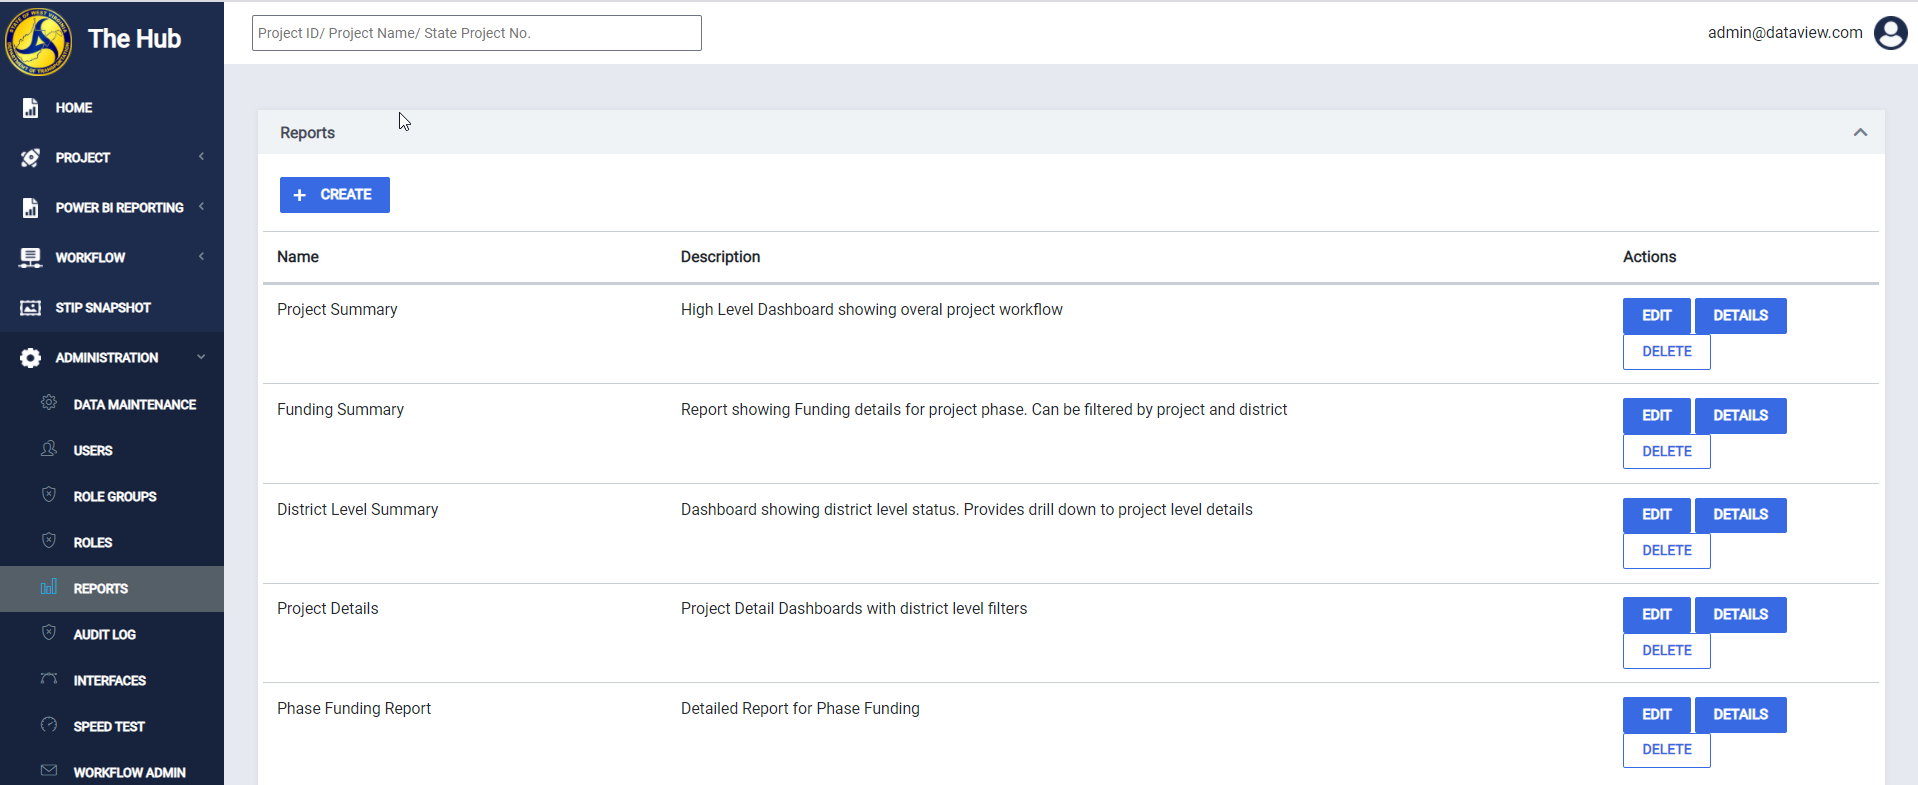
The page is laid out as a table. It has the columns; Name, Description and Action. The Name displays the name of the report; the description displays the description and the Action has three buttons - Edit, Details, Delete.
There is also a '+ Create' button. When you select this button, you are navigated to a new page
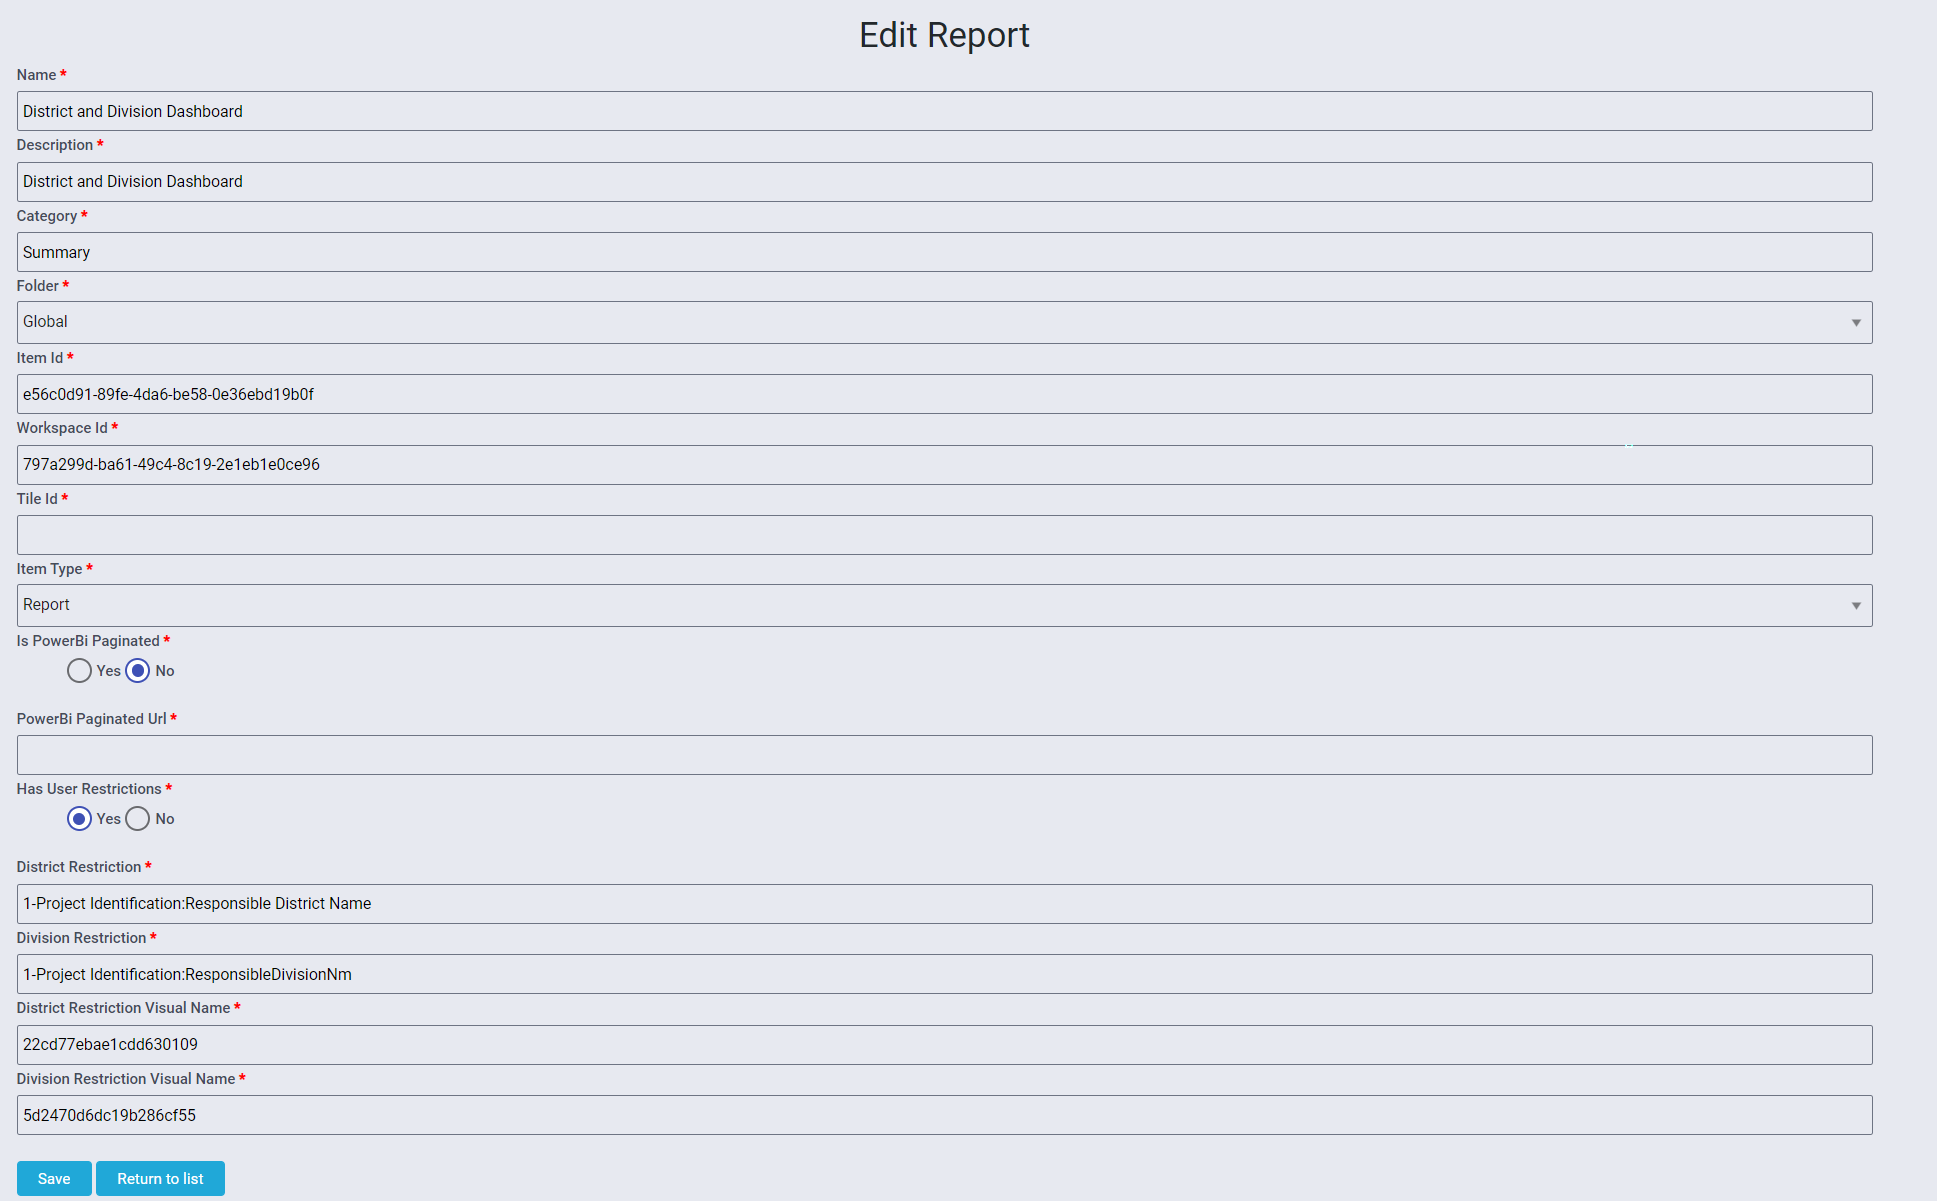
This page has the following fields
- Name: The name of the report. This will be displayed to the users on the report page.
- Description: A description of the report. This will be displayed to the users on the report page.
- Category: A category for the report. This will be displayed to the users on the report page.
- Folder: A folder for the report. This will be displayed to the users on the report page.
- ItemId: The PowerBI Item ID. For more information on how to find the ItemID, refer to this Microsoft Power BI article: Embed content in your Power BI embedded analytics application - Power BI | Microsoft Docs.
- WorkspaceId: The PowerBI Workspace ID. For more information on how to find the Workspace ID, refer to this Microsoft Power BI article: Embed content in your Power BI embedded analytics application - Power BI | Microsoft Docs.
- TitleID
- IsPowerBIPaginated: Used to indicate if the Power BI report is paginated or a dashboard.
- PowerBIPaginated URL: Link to the PowerBIPaginated report.
- Division/District Default: Used to indicate whether a specified report slicer should be defaulted to a user-specific data view. At this time, the Hub supports both District and Division defaults.
- District Default Visual Name: The name of the slicer that the District Default should be applied to. For information on how to find this information, refer to this Microsoft Power BI article: Use selectors to control which visuals are effected in Power BI embedded analytics | Microsoft Docs.
- District Default Visual ID: The ID of the slicer that the District Default should be applied to. For information on how to find this information, refer to this Microsoft Power BI article: Use selectors to control which visuals are effected in Power BI embedded analytics | Microsoft Docs.
- Division Default Visual Name: The name of the slicer that the Division Default should be applied to. For information on how to find this information, refer to this Microsoft Power BI article: Use selectors to control which visuals are effected in Power BI embedded analytics | Microsoft Docs.
- Division Default Visual ID: The ID of the slicer that the Division Default should be applied to. For information on how to find this information, refer to this Microsoft Power BI article: Use selectors to control which visuals are effected in Power BI embedded analytics | Microsoft Docs.
Once all these fields are populated you can select the Submit button to add the report.
Selecting the Edit button on the Reports page opens up a new page. You can update the field values and select the 'Save' button. Once done, you can select the 'Return to List' button and you are presented with the Reports page.
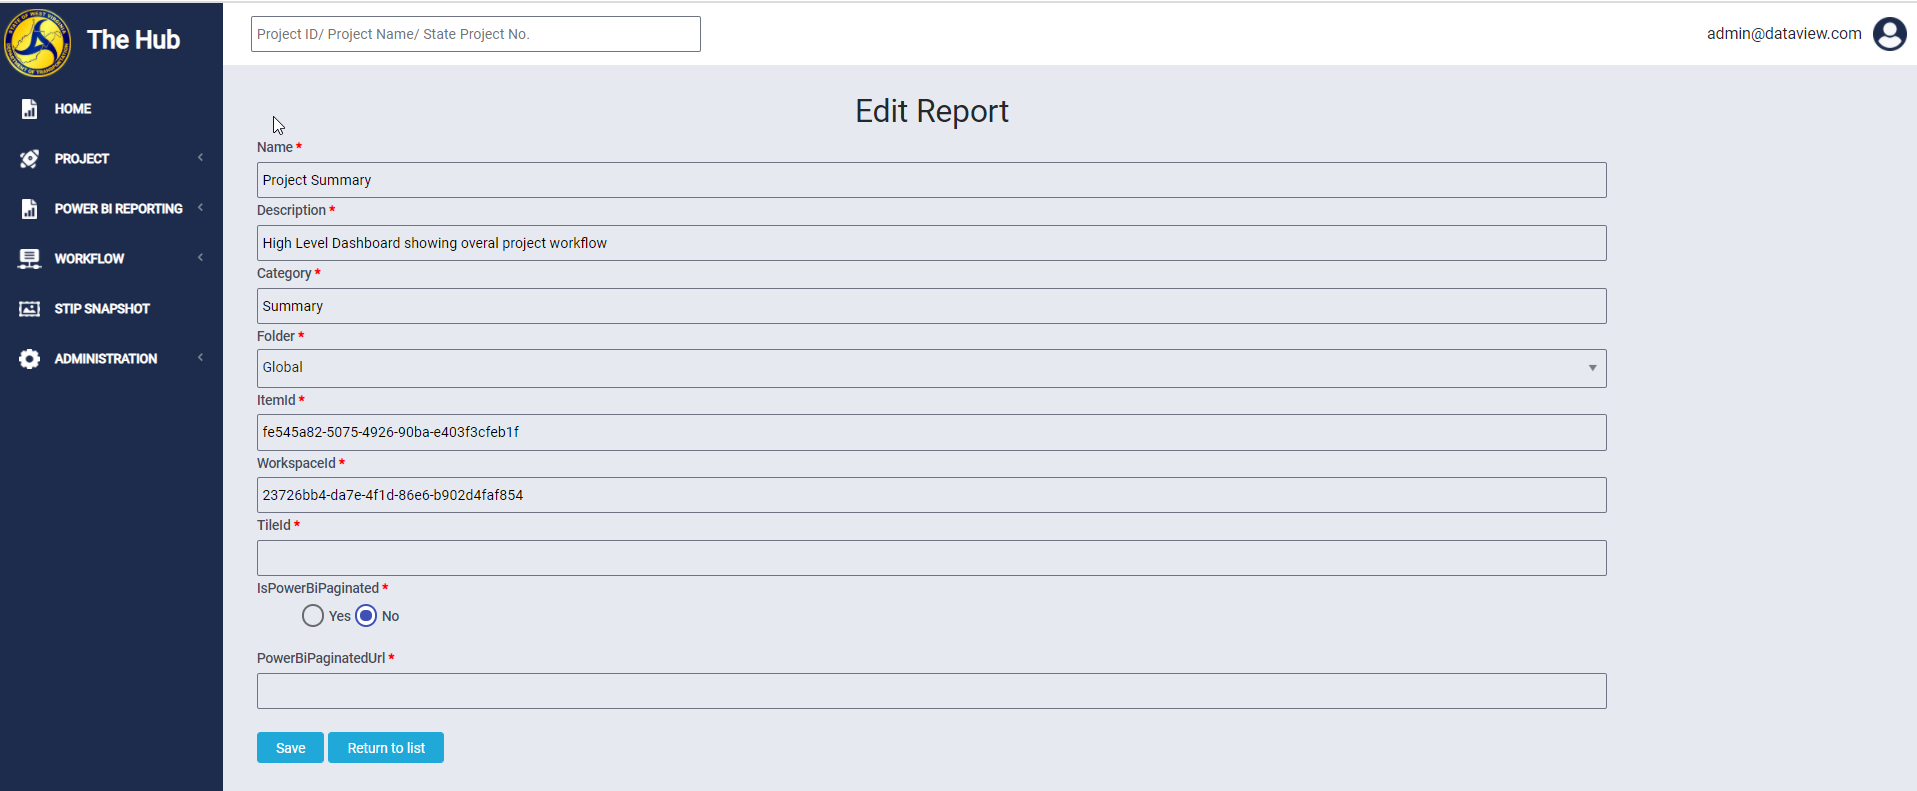
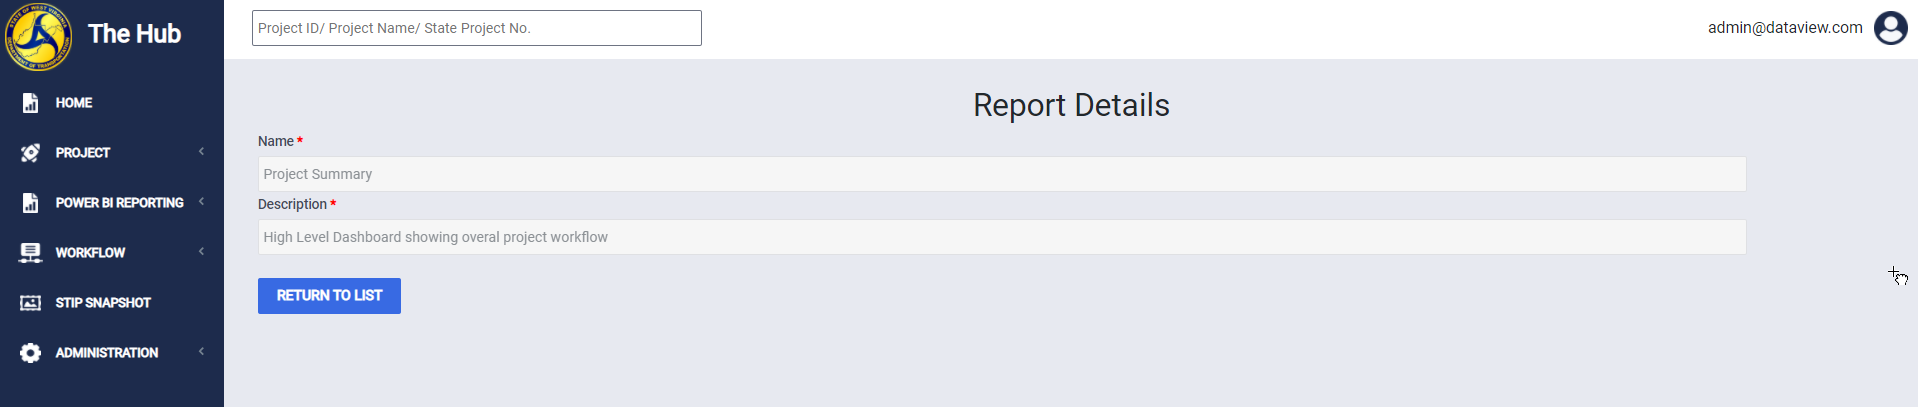
Selecting the Details button navigates you to the details page. The following fields are displayed on this page
Comments
0 comments
Please sign in to leave a comment.